How Well Your Google Ad Account Performs? Understanding Google Ads Optimization Score
Running Google Ads can feel like a guessing game if we don’t know how well our campaigns are set up to perform. With budgets on the line and competition just a click away, it’s crucial to have a clear estimate of our account’s effectiveness. That’s where performance metrics step in, helping us understand whether our ads are reaching the right people and driving results.
One of the most talked-about indicators is the Optimization Score. This score measures how closely our campaigns align with Google’s best practices, taking into account factors like ad relevance, click-through rate, and landing page experience. By monitoring this score, we get a quick snapshot of our account’s health and can spot areas that need improvement. Knowing what drives this estimate helps us make smarter decisions and boost our return on investment.
What is the Google Ads Optimization Score?
Google Ads Optimization Score estimates how well our account aligns with Google’s best practices for campaign setup, management, and performance. The score appears as a percentage from 0 to 100, calculated in real time using account statistics like click-through rate, conversion rate, campaign status, active recommendations, and settings alignment.
A higher Optimization Score signals that our campaigns follow Google-recommended strategies, including relevant keyword selection, effective ad copy, actionable call-to-actions, and use of extensions for added visibility. For example, Google flags missing ad extensions or low-relevance keywords through direct recommendations with each carrying a specific estimated impact—ranging from increases of 0.1% to 5% or more—on our total score.

The score dynamically updates when we accept, dismiss, or ignore Google’s actionable suggestions in the account Recommendations tab. Google factors campaign health, such as the proportion of active campaigns and responsiveness to recommendations, into its calculations. For instance, campaigns may show scores from 65% to 86% even when return on ad spend targets are being met, indicating that Optimization Score is one metric among many for assessing account health.
Tracking this score alongside our core business objectives provides a comprehensive view of how well our Google Ads campaigns are optimized for continual performance improvement.
Related article: https://agrowth.io/google-ads/optimization/
How to Find Your Optimization Scores
Finding our Google Ads Optimization Scores involves navigating to the campaign dashboard in our account. The system displays a percentage score for each active campaign under the “Optimization Score” column. Scores range from 0 to 100, representing how well our campaign settings, ad relevance, and adoption of recommendations align with Google’s standards.
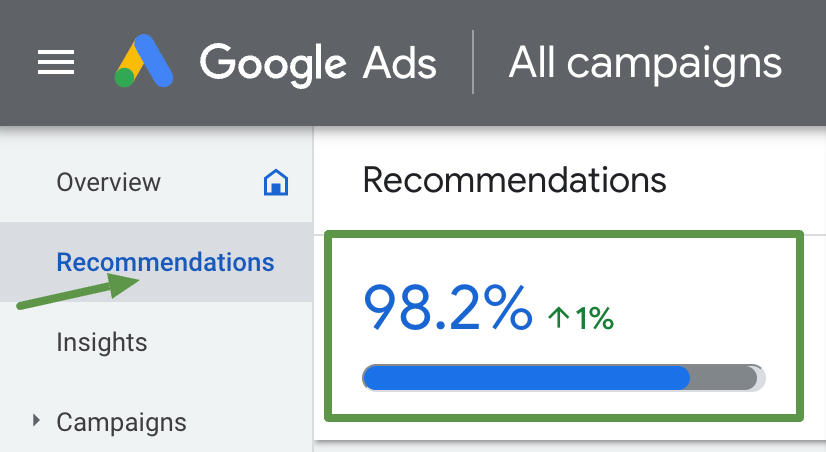
We can view specific recommendations by selecting the “Recommendations” tab in the left navigation pane. Here, Google lists tailored suggestions organized by topics like bidding strategies, keyword coverage, ad creatives, and measurement. Each recommendation shows its estimated impact on our overall optimization score.
Optimization scores appear at the campaign, account, and manager account levels. Only active campaigns in formats such as Search, Display, Video, Performance Max, Demand Gen, App, Action, and Shopping offer this metric. Historical data and status changes cause these scores to update dynamically as we carry out or dismiss recommendations.
Tracking our optimization score alongside core metrics—like CTR, conversion rate, and Quality Score—offers a comprehensive snapshot of campaign effectiveness and alignment with best practices.
How does Google calculate optimization score?
Google calculates optimization score using real-time analysis of core metrics and account elements. The score appears as a percentage from 0 to 100, reflecting both how closely our ad campaigns align with Google’s recommended practices and how many available improvements we’ve implemented.
Optimization Score Calculation Factors
- Account Statistics
Google uses statistics like impressions, click-through rates (CTR), conversion rates, and Quality Score to quantify recent campaign performance.
- Settings Alignment
System checks if settings—such as targeting, conversion tracking, and ad rotation—meet best practice guidelines.
- Campaign Status
Only active campaigns contribute to the optimization score. Performance data from these campaigns form the calculation’s basis.
- Recommendations Implementation
Google offers actionable recommendations, each weighted by its potential impact. Accepting, dismissing, or ignoring suggestions adjusts the score dynamically.
- Bidding Strategy and Budget Utilization
Alignment between chosen bidding strategies—such as target CPA or ROAS—and intended objectives plays a critical role.
- Keyword and Ad Group Coverage
Google examines how comprehensively our keyword selections and ad group structures cover relevant user queries.
- Ad Extensions and Assets
Presence and relevance of ad extensions like sitelinks, callouts, and structured snippets impact the score’s calculation.
- Landing Page Quality
The platform assesses the user experience and relevance of our landing pages, linking them to ad intent.
Weighted Recommendations Impact Table
| Factor | Example Recommendations | Relative Impact |
| Account statistics | Improve CTR, raise conversion rate | High |
| Settings alignment | Enable conversion tracking | Moderate |
| Campaign status | Pause/enable campaigns | Moderate |
| Recommendations implementation | Apply/adopt keyword suggestions | High |
| Bidding and budgets | Switch to smart bidding | High |
| Keywords and groups | Add negative keywords, restructure groups | Moderate |
| Ad extensions and assets | Add callouts or structured snippets | Moderate |
| Landing page quality | Optimize for mobile, speed, relevance | Moderate |
Each approved or dismissed recommendation instantly recalculates the optimization score, updating our account overview. By monitoring these areas and responding to Google’s recommendations, we maintain and improve the alignment of our campaigns with proven strategies.
Additional Metrics for Comprehensive Evaluation
Assessing Google Ads account performance requires tracking multiple metrics, each offering unique insight into campaign effectiveness beyond the Optimization Score.
- Ad Rank
Ad Rank determines our ad’s position relative to competitors in the auction. Higher Ad Rank drives visibility and click opportunities, and it reflects a combination of bid, ad quality, and ad extensions.
- Search Impression Share
Search Impression Share compares our ad impressions to the total possible impressions for targeted queries. Higher impression share signals good ad visibility and strong competitive presence in the search environment.
- Quality Score
Quality Score measures ad relevance, expected click-through rate, and landing page experience. Scores of 7 or higher (on a 1–10 scale) indicate effective messaging and alignment with audience intent.
- Cost Per Acquisition (CPA)
CPA tracks the average cost to generate a conversion. Lower CPA values, such as $20 per acquisition in ecommerce, highlight campaign efficiency in delivering returns for our spend.
- Return on Ad Spend (ROAS)
ROAS calculates the revenue earned for every dollar spent. A campaign with a $500 spend generating $2,000 revenue results in a 400% ROAS, confirming financial efficiency.
- Landing Page Experience
Landing Page Experience evaluates relevance and user satisfaction on post-click destinations. High experience scores improve ad rank and Quality Score, supporting stronger performance.
- Impressions and Clicks
Tracking Impressions and Clicks quantifies how often our ads reach users and prompt engagement. For example, 100,000 impressions with 5,000 clicks yield a 5% click-through rate, indicating message resonance.
We include these metrics in our analysis to understand campaign strengths, optimization opportunities, and financial impact. Aligning results from these metrics with core business goals ensures robust and actionable performance evaluation.
Enhancing Your Google Ads Optimization Score
Continuous optimization of our Google Ads Optimization Score drives campaign effectiveness and identifies actionable improvements. We increase campaign performance by applying structured strategies targeting both quick wins and ongoing adjustments.

Strategies for Improvement
Improvement strategies involve prioritizing actionable insights, leveraging Google’s recommendations, and maintaining ongoing optimization workflows.
1. Practical Steps to Enhance Optimization Score
We start improvement by analyzing the Recommendations tab in our Google Ads dashboard. Action items include:
- Adding relevant keywords (e.g., high search volume terms) to boost campaign reach.
- Adjusting bids to optimize for metrics like cost-per-click (CPC) or return on ad spend (ROAS).
- Refining ad copy to align with target keywords and include strong calls-to-action.
- Enabling ad extensions (e.g., sitelinks, callouts) to enhance ad visibility.
- Optimizing landing pages by improving load speed, ensuring mobile responsiveness, and increasing conversion-focused design.
2. Leveraging Recommendations
We prioritize Google’s categorized recommendations, focusing first on repairs since they carry the greatest impact on the Optimization Score. Categories include:
- Repairs: Resolving critical issues like disapproved ads or broken URLs.
- Budgets & Bidding: Adjusting budget caps and switching to optimal bidding strategies for efficient spend.
- Keywords & Targeting: Removing duplicates or expanding keyword lists to target relevant audiences.
- Ads & Assets: Testing new creative variants and improving asset quality.
- Automated Campaigns: Activating automated bidding and campaign structures for better consistency.
- Measurement: Enabling conversion tracking and enhancing attribution models.
Each recommendation lists a potential score increase, helping us prioritize changes that drive the most improvement.
3. Regular Monitoring and Adjustments
We track optimization scores regularly and modify strategies as recommendations and performance data evolve. This workflow includes:
- Reviewing score changes weekly for all active campaigns.
- Monitoring score ranges (e.g., 65%–86%) to identify underperforming segments.
- Implementing new recommendations and re-assessing their impact.
- Comparing Optimization Score trends against core metrics like Quality Score, CTR, and conversion rates.
Maintaining this cycle ensures alignment with best practices and adapts campaigns to current goals and market trends.
How does optimization score differ from Quality Score?
Optimization Score and Quality Score represent distinct evaluation points in Google Ads campaign management.
- Optimization Score quantifies campaign alignment with Google’s recommendations, reflecting the potential for improvement. This score appears as a percentage from 0 to 100, adjusts in real time, and responds to the adoption or dismissal of Google-driven recommendations. We use it to identify actionable opportunities for enhancing bidding strategies, adding new keywords, or enabling ad extensions. The primary function centers on highlighting campaign improvements based on current ad ecosystem trends and active campaign data.
- Quality Score, by contrast, assesses the relevance and expected performance of our ads at the keyword level. This metric includes expected click-through rate, ad relevance, and landing page experience. When Quality Scores rise, our ads become more cost-efficient and eligible for higher positions in search results, referencing Google’s ad auction process. Unlike Optimization Score, Quality Scores directly impact our ad placement and Cost Per Click, as higher scores reduce overall expenses and boost ad rank.
Both metrics share connections to ad relevance and user experience, but Optimization Score focuses on adopting best practices across campaign settings, while Quality Score measures ad and landing page quality in user search intent contexts. We view Optimization Score as a framework for ongoing account improvement, and Quality Score as a measure of each ad’s value in Google’s auction. By tracking both, we strengthen our campaigns’ efficiency and alignment with user needs and platform standards.
Frequently Asked Questions
What is the Google Ads Optimization Score?
The Google Ads Optimization Score is a percentage from 0 to 100 that indicates how well your campaigns follow Google’s best practices. It combines various metrics and recommendations to show how effectively your campaigns are set up and managed.
How is the Optimization Score calculated?
The Optimization Score is calculated in real time based on factors like click-through rates, conversion rates, campaign settings, and the adoption of Google’s recommendations. Each suggestion is weighted by its potential impact, updating your score as you implement or dismiss changes.
Where can I find my Google Ads Optimization Score?
You can find your Optimization Score on the campaign dashboard, displayed under the “Optimization Score” column. Individual campaign scores and related recommendations are also available in the “Recommendations” tab.
Why is the Optimization Score important?
The Optimization Score helps advertisers quickly assess account health and identify ways to improve performance according to Google’s guidelines, leading to smarter decisions and potentially higher return on investment (ROI).
What should I do if my Optimization Score is low?
If your Optimization Score is low, review the recommendations provided by Google in your account. Implement relevant suggestions, such as refining keywords, adjusting bids, improving ad copy, and enhancing landing pages to boost your score and performance.
Is the Optimization Score the only metric I should track for Google Ads?
No, you should monitor multiple metrics for a complete view of performance, including Ad Rank, Search Impression Share, Quality Score, Cost Per Acquisition (CPA), Return on Ad Spend (ROAS), Impressions, and Clicks.
How can I improve my Google Ads Optimization Score?
Focus on regularly reviewing and acting on recommendations, updating keywords, adjusting bidding strategies, enabling ad extensions, refining ad creatives, and optimizing landing pages to better align with best practices.
What’s the difference between Optimization Score and Quality Score?
The Optimization Score measures how well your campaigns follow Google’s overall recommendations, while the Quality Score evaluates the relevance and expected performance of your ads at the keyword level.
Does accepting all recommendations guarantee better performance?
Not always. While recommendations are designed to improve account performance, you should use your business goals and campaign data to decide which suggestions are most relevant for your strategy.
How often is the Optimization Score updated?
The Optimization Score updates dynamically in real time whenever you act on, ignore, or dismiss recommendations, or as new relevant data becomes available in your account.


Your comment